Regardless of the season, whether it is the scorching hot summer or chilly winter, Al Sadeem Observatory regularly observes the Sun in monitoring daily changes in sunspot morphology which corresponds to its dynamic activity with additional information about solar flares from the NOAA-Space Weather Prediction Center (SWPC), and Solar Influences Data Center (SIDC). Here is our 1st annual sunspot monitoring report from Al Sadeem Astronomy (ASA) Observatory.
The equipment used for the observations are Skywatcher 102 and 120mm refractor telescopes with Baader Filter, Lunt 100mm H-Alpha telescope, either mounted on Skywatcher Alt-Az, EQ3 or EQ6, Celestron 25mm eyepiece (for visual observations), Canon EOS 1D Mark IV for full-disk images, and GSO 2.5x barlow lens (for close-up views), and ZWO120MM/1600MC-Cool CMOS cameras for H-alpha images. Daily solar observations were performed by Al Sadeem Astronomy Observatory’s resident astronomer Aldrin B. Gabuya. The formal sunspot observation commenced on May 21, 2017, up to May 31, 2018.
Sunspot numbers (R) were computed using the formula R=k(10g+s) wherein R = sunspot number, k = variable coefficient based on seeing conditions (assigned as 1), g = number of sunspot groups, and s = number of individual spots.
Here are the following findings:
- Total R of 5288 during the entire annual observing period.
- 129 spotless days
- September 2017 got the highest total R (month)
- September 5, 2017, got the highest R per day (114)
- March 2018 has the most number of spotless days (22)
- September 2017 got the highest average sunspot number with 41.53 while March 2018 has the least with 2.71.
Overall, solar activity is at its relatively low state. The low sunspot numbers signify the ongoing solar minimum wherein the Sun exhibits less solar activity being reflected by the absence or less sunspots appearing on the Sun’s surface, and little occurrence of solar flares. It is expected to peak in 2019 and eventually reverse its magnetic polarity afterward.
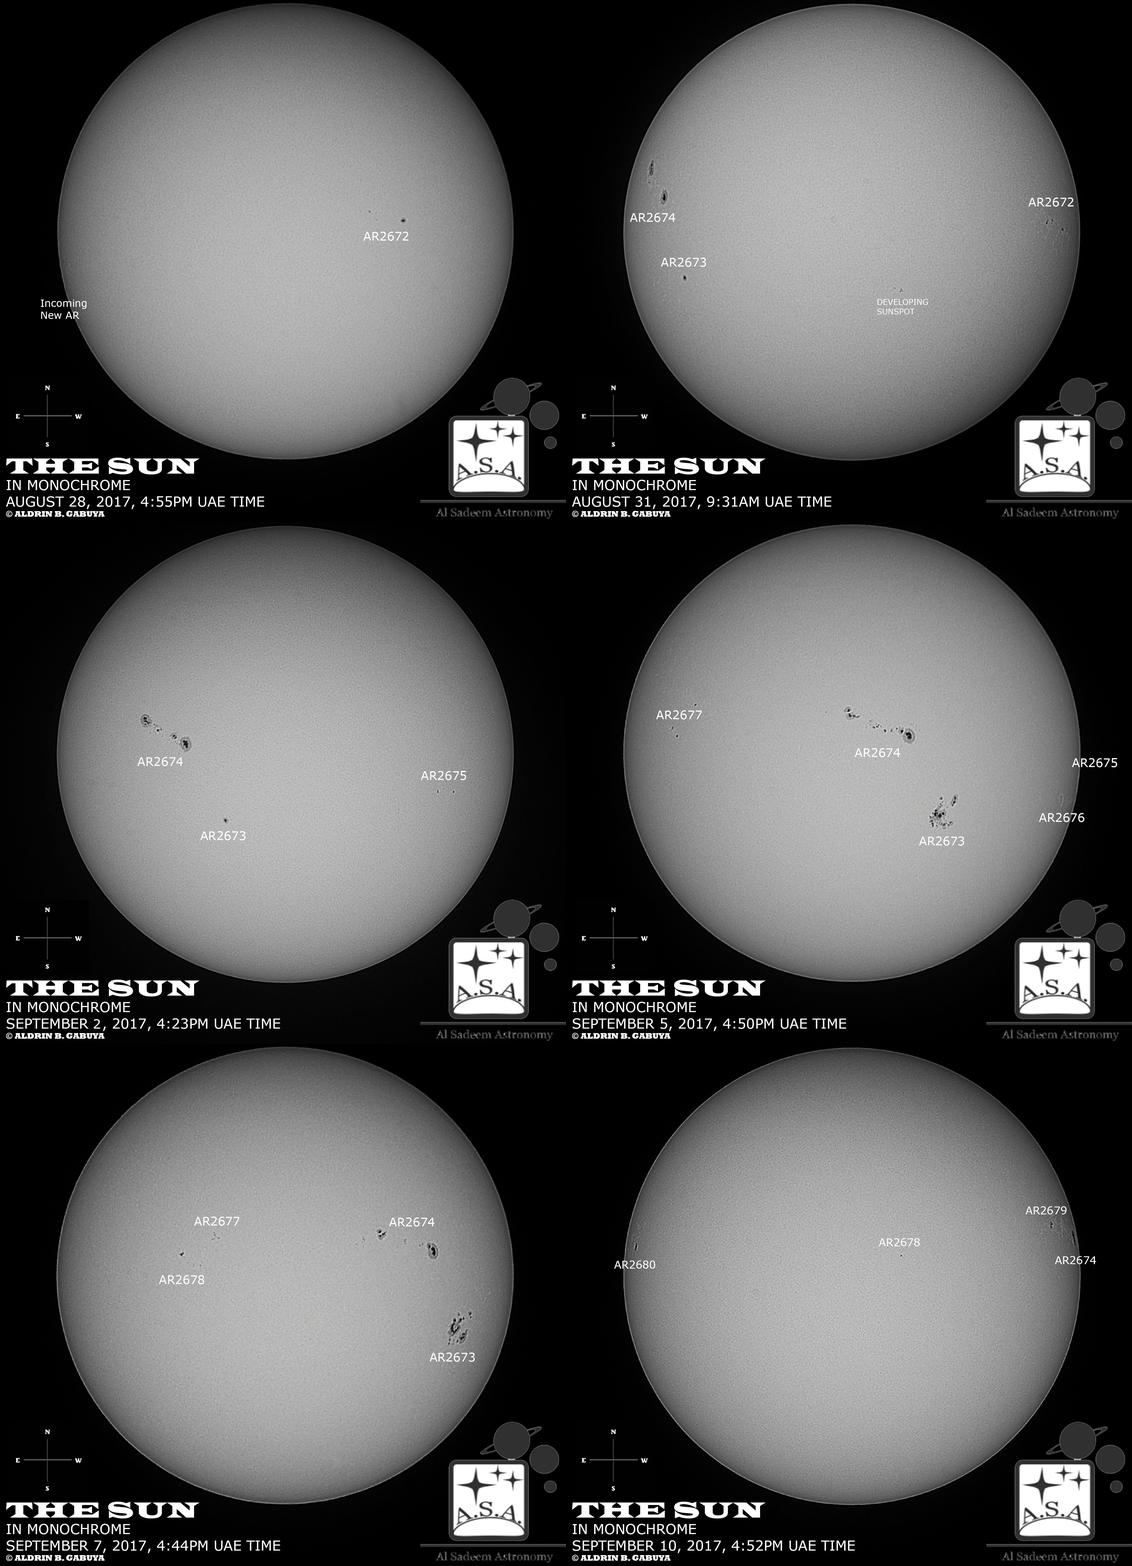
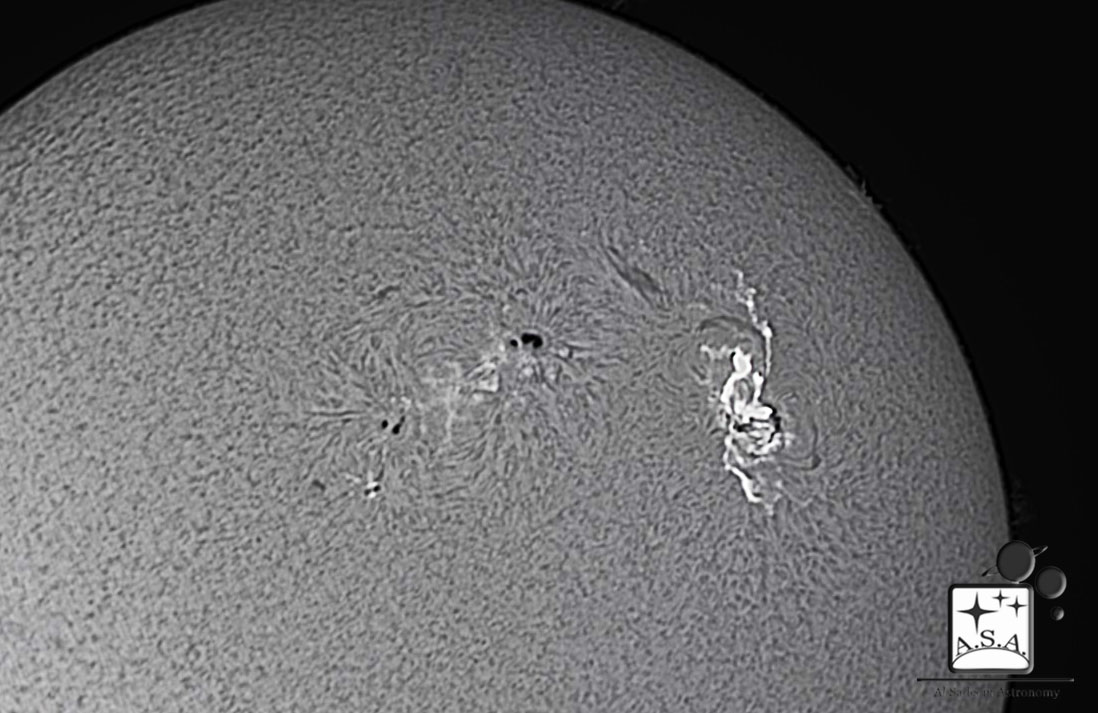
On September 5-6, 2017, AR2673 and AR2674 brought the surprising boost in solar activity in which quickly emerged, grew rapidly in structure and generated huge amounts of solar flares and a coronal mass ejection (CME), particularly the powerful X 9.3 flare produced by AR2673, which caused geomagnetic storms that brought brief radio satellite communication blackouts and dazzling aurora activity at the polar regions a few days later [1][2].

The observatory continues to monitor the Sun’s activity for the rest of 2018. Check out the observatory’s daily sunspot monitoring information at http://alsadeemastronomy.ae/category/sunspot-monitoring
APPENDICES


REFERENCES
[1] Major X9.33 solar flare (6 September 2017). SpaceWeatherLive.com. Retrieved from https://www.spaceweatherlive.com/en/news/view/301/20170906-major-x933-solar-flare
[2] A Week of an Energetic Sun (12 September 2017). Al Sadeem Astronomy. Retrieved from http://alsadeemastronomy.ae/a-week-of-an-energetic-sun/
FURTHER SOLAR INFORMATION LINKS
[1]http://solarham.net/
[2]http://sidc.oma.be/
[3]http://spaceweather.com/


